


Fibonacci retracement level is one
of the very popular tools used for technical analysis in stock
market.This method is used to determine the support and resistance
levels. It is based on the key numbers which was first identified in
thirteenth century by the mathematician Leonardo of Pisa, who is also
called Fibonacci.
Fibonacci retracement theory is based on the idea that markets will retrace a predictable portion of a move, after which they will continue to move in the original direction.
The start of the retracement level is '0%' and when it reaches 100% there will be a reversal to the original path.
Fibonacci series
The fibonacci numbers or fibonacci sequence is called as fibonacci series.
Look at this,
0, 1, 1, 2, 3, 5, 8, 13, 21, 34, 55, 89, 144, 233, 377, 610........
Here 'o' and '1' are the first two numbers in the fibonacci series. There after all numbers are the sum of previous two numbers.
For example the third number '1' is the sum of first number '0' and second number '1'.The fourth number '2' is the sum of second number '1' and third number '1' and so on...
This sequence can also be extend to negative like this
−21, 13, −8, 5, −3 , 2 , −1, 1, 0, 1, 1, 2, 3, 5, 8, 13, 21, 34, 55, 89, 144, 233, 377, 610...
Fibonacci ratio
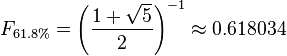
The fibonacci ratios are derived from fibonacci series. The key Fibonacci ratios are 0%, 23.6%, 38.2%, 50%, 61.8% and 100%.
The 78.6% (0.786) ratio is :
The 50% (0.50) ratio is not really a fibonacci ratio. It is derived from dividing the number 1 (second number in the series) by the number 2 (third number in the series).
As I said earlier fibonacci retracement levels are used to trade on stock market, currency and commodity markets. It is also said that the key fibonacci ratios are 0%, 23.6%, 38.2%, 50%, 61.8% and 100%. 76.4% and 78.6% are also used by several traders. We also know that o% is the start and 100% is the reverse path. In the price movements of a security the 0.236, 0.382, 0.5, 0.618, 0.764 and 0.786 retracement levels act as the potential resistance and support point.
I have earlier mentioned that markets will retrace a predictable portion of a move, after which they will continue to move in the original direction.
Now let us come to the point.The Fibonacci retracement is the potential retracement of a financial asset's (stocks, commodities or currencies) original movement in price. Here the ongoing trend stops and new trend starts against its previous trend. In supports the price starts going lower and in resistance the price stops going higher. And then going against the trend.If it happens this is a correction and one can enter the counter here.
Trade using fibonacci retracement levels
The fibonacci retracement levels are here divided in to three areas.
Range bound area-Now suppose the security is trading between 38.2% and 23.6% levels.That is security gets support at 38.2% level and gets resistance at 23.6 per cent level or gets support at 23.6 per cent and resistance at 38.2 per cent level.If a breakout not happens there is a chance of range bound trading.
Medium area -The security is trading between 50% and 38.6% levels.That is gets support at 50% level and resistance at 38.2% level or gets support at 38.6% level and resistance at 50% level.There is a possibility that market may go to the previous trend.
Danger Area- The security is trading between 78.6% and 50% levels.That is the security gets support at 76.4% to 78.6% levels and resistance at 61.8% level (golden level) or resistance at 50% level and support at 76.4% to 78.6% level.Then the security may not go to the previous trend.
Entry point for a trader
If you are long on a security which is trading at danger area from the swing high, go for short with 50% level as the first stop loss and 38.2 per cent level as second stop loss.You may fix targets at 100%, 127% and 161.8% levels from the swing high.
If the security is trading at danger area from the swing low you can go long on that scrip with 50% level as the first stop loss and 38.2% as the second stop loss.Targets are 100% level, 127% level and 161.8% level from the swing low.
Fibonacci retracement theory is based on the idea that markets will retrace a predictable portion of a move, after which they will continue to move in the original direction.
The start of the retracement level is '0%' and when it reaches 100% there will be a reversal to the original path.
Fibonacci series
The fibonacci numbers or fibonacci sequence is called as fibonacci series.
Look at this,
0, 1, 1, 2, 3, 5, 8, 13, 21, 34, 55, 89, 144, 233, 377, 610........
Here 'o' and '1' are the first two numbers in the fibonacci series. There after all numbers are the sum of previous two numbers.
For example the third number '1' is the sum of first number '0' and second number '1'.The fourth number '2' is the sum of second number '1' and third number '1' and so on...
This sequence can also be extend to negative like this
−21, 13, −8, 5, −3 , 2 , −1, 1, 0, 1, 1, 2, 3, 5, 8, 13, 21, 34, 55, 89, 144, 233, 377, 610...
Fibonacci ratio
The fibonacci ratios are derived from fibonacci series. The key Fibonacci ratios are 0%, 23.6%, 38.2%, 50%, 61.8% and 100%.


In addition to these ratios stock market traders use 50%, 76.4% and 78.6% levels.
The 76.4% (0.764) ratio is the result of subtracting 0.236 from the number 1.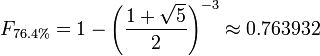
The 78.6% (0.786) ratio is :

The 50% (0.50) ratio is not really a fibonacci ratio. It is derived from dividing the number 1 (second number in the series) by the number 2 (third number in the series).

As I said earlier fibonacci retracement levels are used to trade on stock market, currency and commodity markets. It is also said that the key fibonacci ratios are 0%, 23.6%, 38.2%, 50%, 61.8% and 100%. 76.4% and 78.6% are also used by several traders. We also know that o% is the start and 100% is the reverse path. In the price movements of a security the 0.236, 0.382, 0.5, 0.618, 0.764 and 0.786 retracement levels act as the potential resistance and support point.
I have earlier mentioned that markets will retrace a predictable portion of a move, after which they will continue to move in the original direction.
Now let us come to the point.The Fibonacci retracement is the potential retracement of a financial asset's (stocks, commodities or currencies) original movement in price. Here the ongoing trend stops and new trend starts against its previous trend. In supports the price starts going lower and in resistance the price stops going higher. And then going against the trend.If it happens this is a correction and one can enter the counter here.
Trade using fibonacci retracement levels
The fibonacci retracement levels are here divided in to three areas.
Range bound area-Now suppose the security is trading between 38.2% and 23.6% levels.That is security gets support at 38.2% level and gets resistance at 23.6 per cent level or gets support at 23.6 per cent and resistance at 38.2 per cent level.If a breakout not happens there is a chance of range bound trading.
Medium area -The security is trading between 50% and 38.6% levels.That is gets support at 50% level and resistance at 38.2% level or gets support at 38.6% level and resistance at 50% level.There is a possibility that market may go to the previous trend.
Danger Area- The security is trading between 78.6% and 50% levels.That is the security gets support at 76.4% to 78.6% levels and resistance at 61.8% level (golden level) or resistance at 50% level and support at 76.4% to 78.6% level.Then the security may not go to the previous trend.
Entry point for a trader
If you are long on a security which is trading at danger area from the swing high, go for short with 50% level as the first stop loss and 38.2 per cent level as second stop loss.You may fix targets at 100%, 127% and 161.8% levels from the swing high.
If the security is trading at danger area from the swing low you can go long on that scrip with 50% level as the first stop loss and 38.2% as the second stop loss.Targets are 100% level, 127% level and 161.8% level from the swing low.


